Visuals
Waffle Chart: Teen Smartphone Addiction Ratio
Interpretation
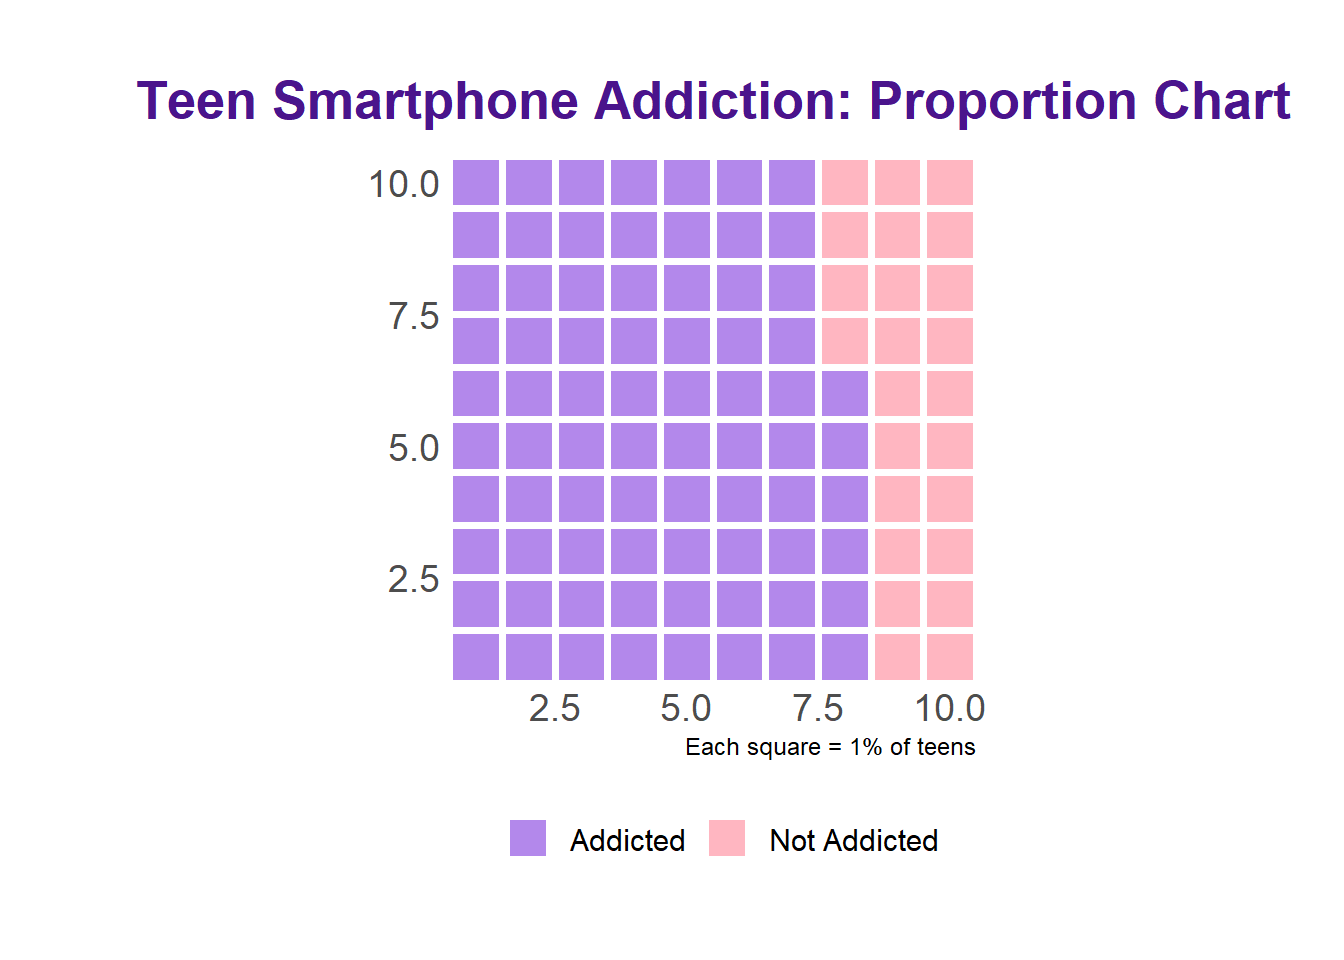
This waffle chart visualizes the proportion of teenagers who are addicted to their smartphones (Addiction_Level ≥ 8).
- Each square represents 1% of the dataset.
- Purple squares = teens classified as Addicted.
- Pink squares = teens classified as Not Addicted.
Key Insight:
A majority of teens in the dataset are addicted. This suggests that smartphone dependency is a serious concern and may require interventions from parents, teachers, and health professionals.
Summary of Visual Insights
- Waffle Chart shows that a majority of teens in the dataset are addicted.
- 3D Surface Plot reveals that addiction probability increases sharply with more screen and social media use.
- These insights can guide awareness campaigns, parental monitoring, and mental health programs targeting smartphone usage among teenagers.